
Cost and Profitability Analysis
Product cost comes from goods receipt and recipes, and sales, comp and waste cost are reported separately. Reading the sales report beside the cost report shows your margin per product.
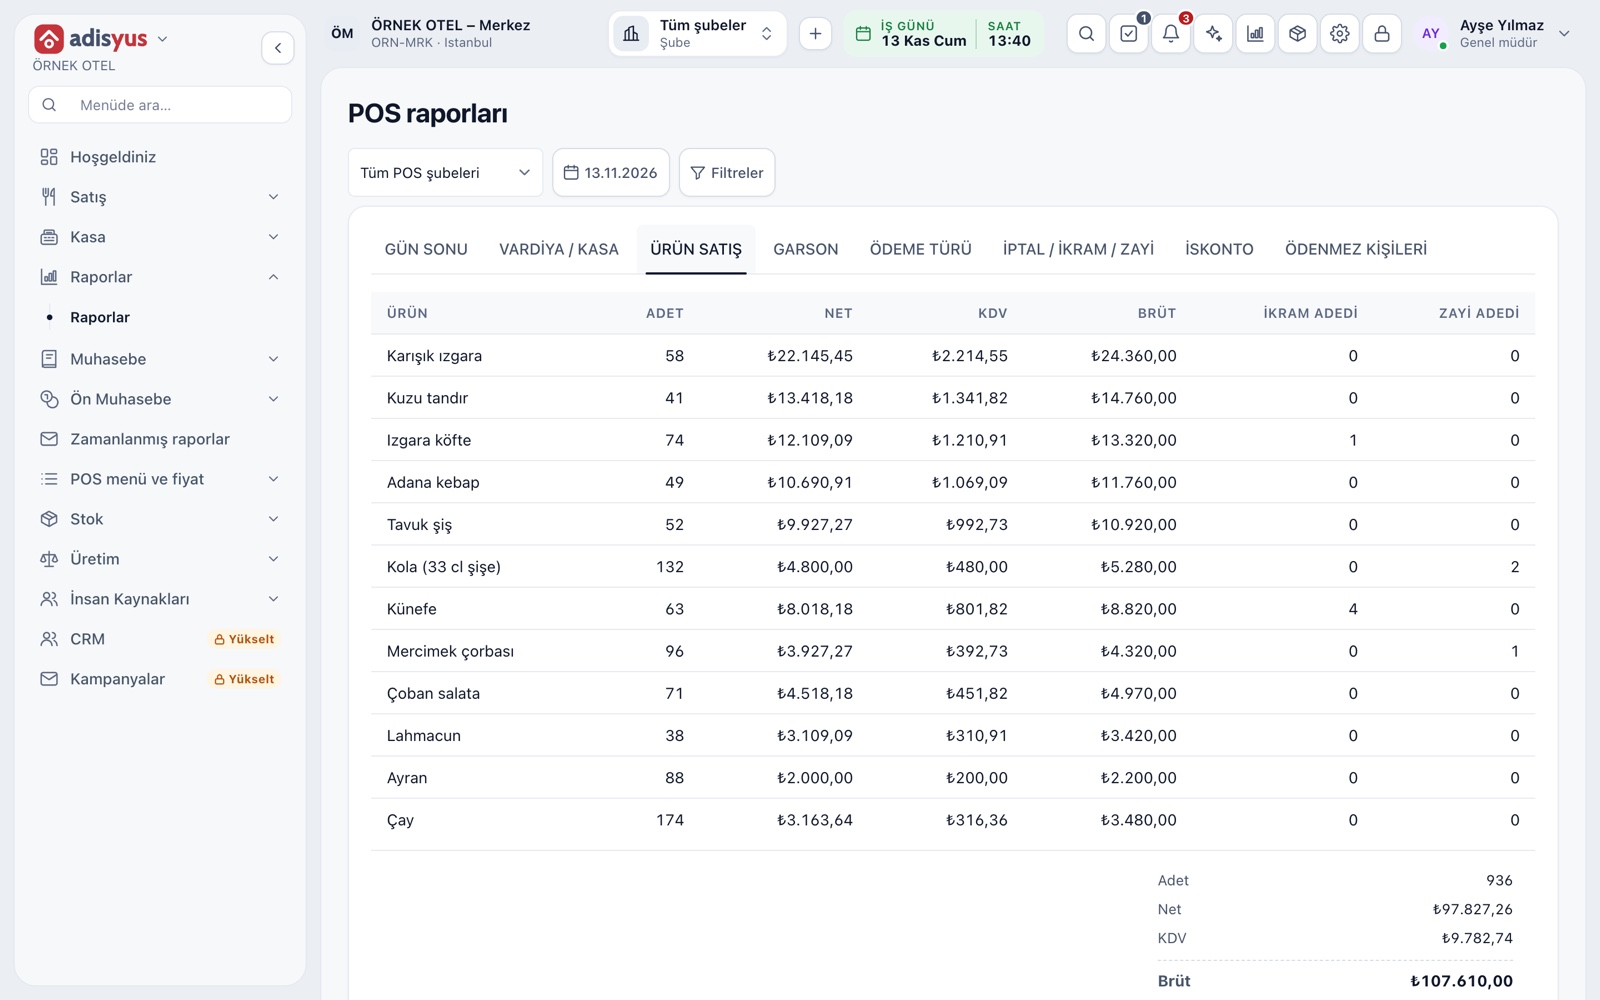
Sales and cost together
The item sales report gives net sales, and the consumption cost report under Stock > Reports gives the cost of sales. Reading the two over the same date range side by side gives you the margin per item. Cost comes from goods receipt and recipes.
- Results recalculate when the date range changes.
- Group by item, POS outlet or raw material.
- Cost reports open only to roles with the cost permission.
Where cost comes from
The first source of cost is goods receipt. Goods from a supplier are received against the delivery note; on approval the stock entry and cost are written and the unit price joins the weighted average. Freight is allocated across line amounts and added to cost.
- Goods receipt is compared with the purchase invoice; a difference is shown.
- The stock card takes its last purchase price from goods receipt.
- An approved document cannot be changed.
Recipe cost
A recipe defines the ingredients and quantities for one unit sold. The cost window shows each ingredient's cost and the total for one unit. There is one recipe per item and portion.
- If an ingredient cost is missing, a warning says the total is incomplete.
- An item set as a semi-finished product becomes a component in other recipes.
- The recipe usage screen lists the recipes an ingredient appears in.
Stock deduction on sale
When a recipe item is sold, its ingredients come off stock; this is switched on with the optional Production module. The moment of deduction is a setting: at send to the kitchen or at check closing. Under the chosen mode a line is never deducted twice.
- Deduction comes from the check; a sales invoice does not touch stock.
- The sales screen shows makeable quantity or only a Sold out warning.
- Selling into negative stock when it runs out is a separate setting.
Consumption cost, comps and waste
The consumption cost report gives the cost of sales, comp cost, waste cost and the total in separate columns. Comps and waste are tracked apart from the cost of sales, so real profit is not mixed with comps and spoilage.
- Waste is entered by hand or from a check and comes off stock with a reason.
- Waste reasons are added and ordered per business.
- A movement with unknown cost is counted separately in the report.
Count differences and efficiency
A stock count compares the real quantity in the store with the system; in a blind count the expected quantity is hidden while counting. The difference of approved counts appears in the report with its value. The efficiency report lists only differences above the tolerance set on the stock card.
- The tolerance is defined on the stock card.
- A count sheet can be printed for paper counting.
- Count differences can be downloaded as CSV.
Modules used together
Stock and Recipe Costing
Recipe-based costing, stock counts and waste tracking
Learn moreWaste and Spoilage
Waste reasons, responsible staff and cost impact
Learn morePOS Reports
Product sales, end of day, shift, statistics, stock status and waste reports
Learn moreMenu and Product Management
Categories, products, photos, favorites and sales status
Learn moreUnits and Portions
Full, half, one and a half, piece, kilogram
Learn moreFrequently Asked Questions
How do I see product profitability?
Read net sales in the item sales report beside the consumption cost under Stock > Reports over the same range. The gap is your gross profit per item.
Is cost calculated for an item without a recipe?
For a stock-tracked ready item such as cola or water, cost comes from the weighted average on its own stock card. For a recipe item, cost is calculated from the ingredients.
How do comps and waste affect profit?
Their costs are tracked in columns apart from the cost of sales, so you see the cost of what you sold and the loss from comps and spoilage separately.
Who can see cost reports?
Roles with the cost-read permission, by default the manager. Cashiers and servers do not see the stock menu or cost reports.
Meet Cost and Profitability Analysis
Let us call you for a live walkthrough, or try it free for 1 month.